Component Evolution
The Component Evolution section in your Airbnb Quality Dashboard helps you understand how your listing’s quality metrics are trending over time. It’s a simple, visual way to spot improvements, identify dips, and make confident decisions to boost your performance.
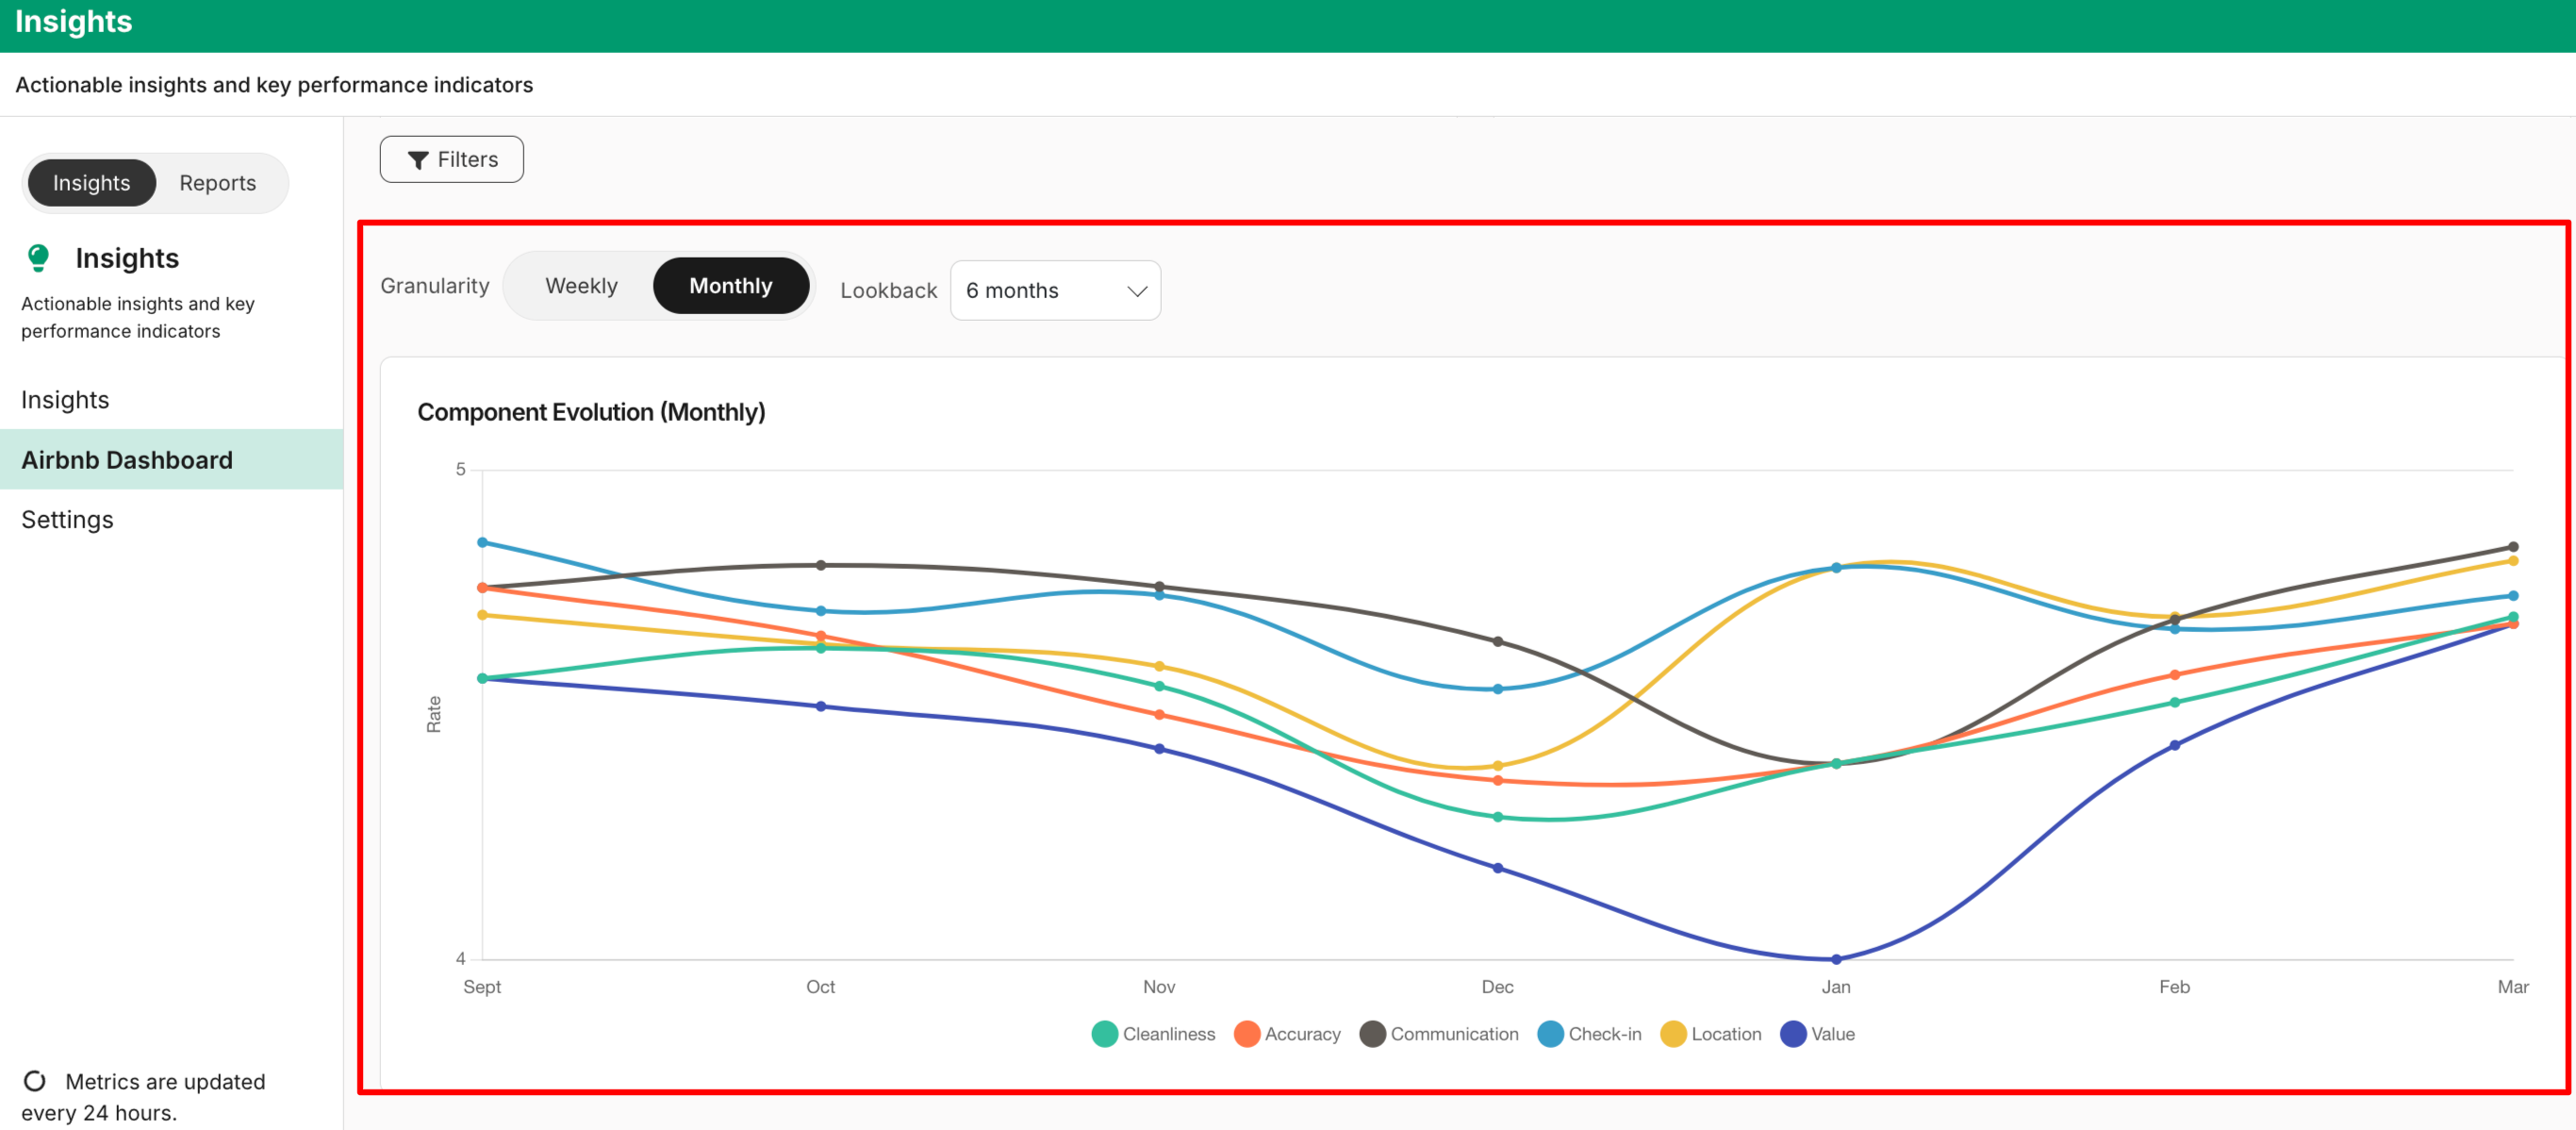
What metrics are included?
You can monitor the following key metrics measured, e.g., cleanliness, accuracy, communication, check-in, location and value:
- The Y-axis represents the average rating
- The X-axis represents the date range the rating was given.
These metrics help you understand both your overall satisfaction level and how consistently you’re delighting guests.
Using the Component Evolution filters
You can customize your view using flexible filters to focus on the time period and trend type that matter most to you. Choose Your Trend View: Weekly or Monthly:
- Weekly – Best for spotting short-term changes or recent improvements.
- Monthly – Ideal for understanding broader performance patterns.
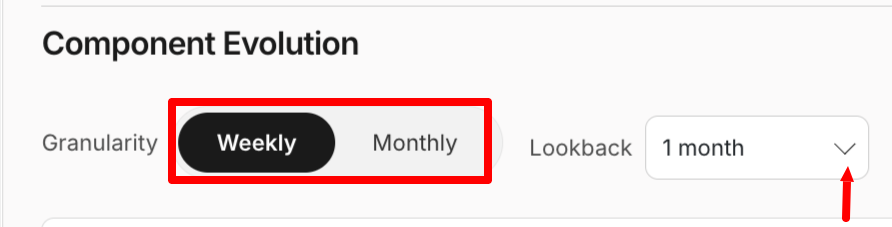
Select Your Lookback Period
You can mix and match filters to choose how far back you want to analyze your data : (e.g., 1 month, 3 months, 6 months, 1 year, 2 years, or All time)
Updated 2 months ago