Latest Updates
These metrics appear at the top of the dashboard and provide a quick overview of your Airbnb listing performance. You can use them to monitor quality, identify trends, and take action when needed.
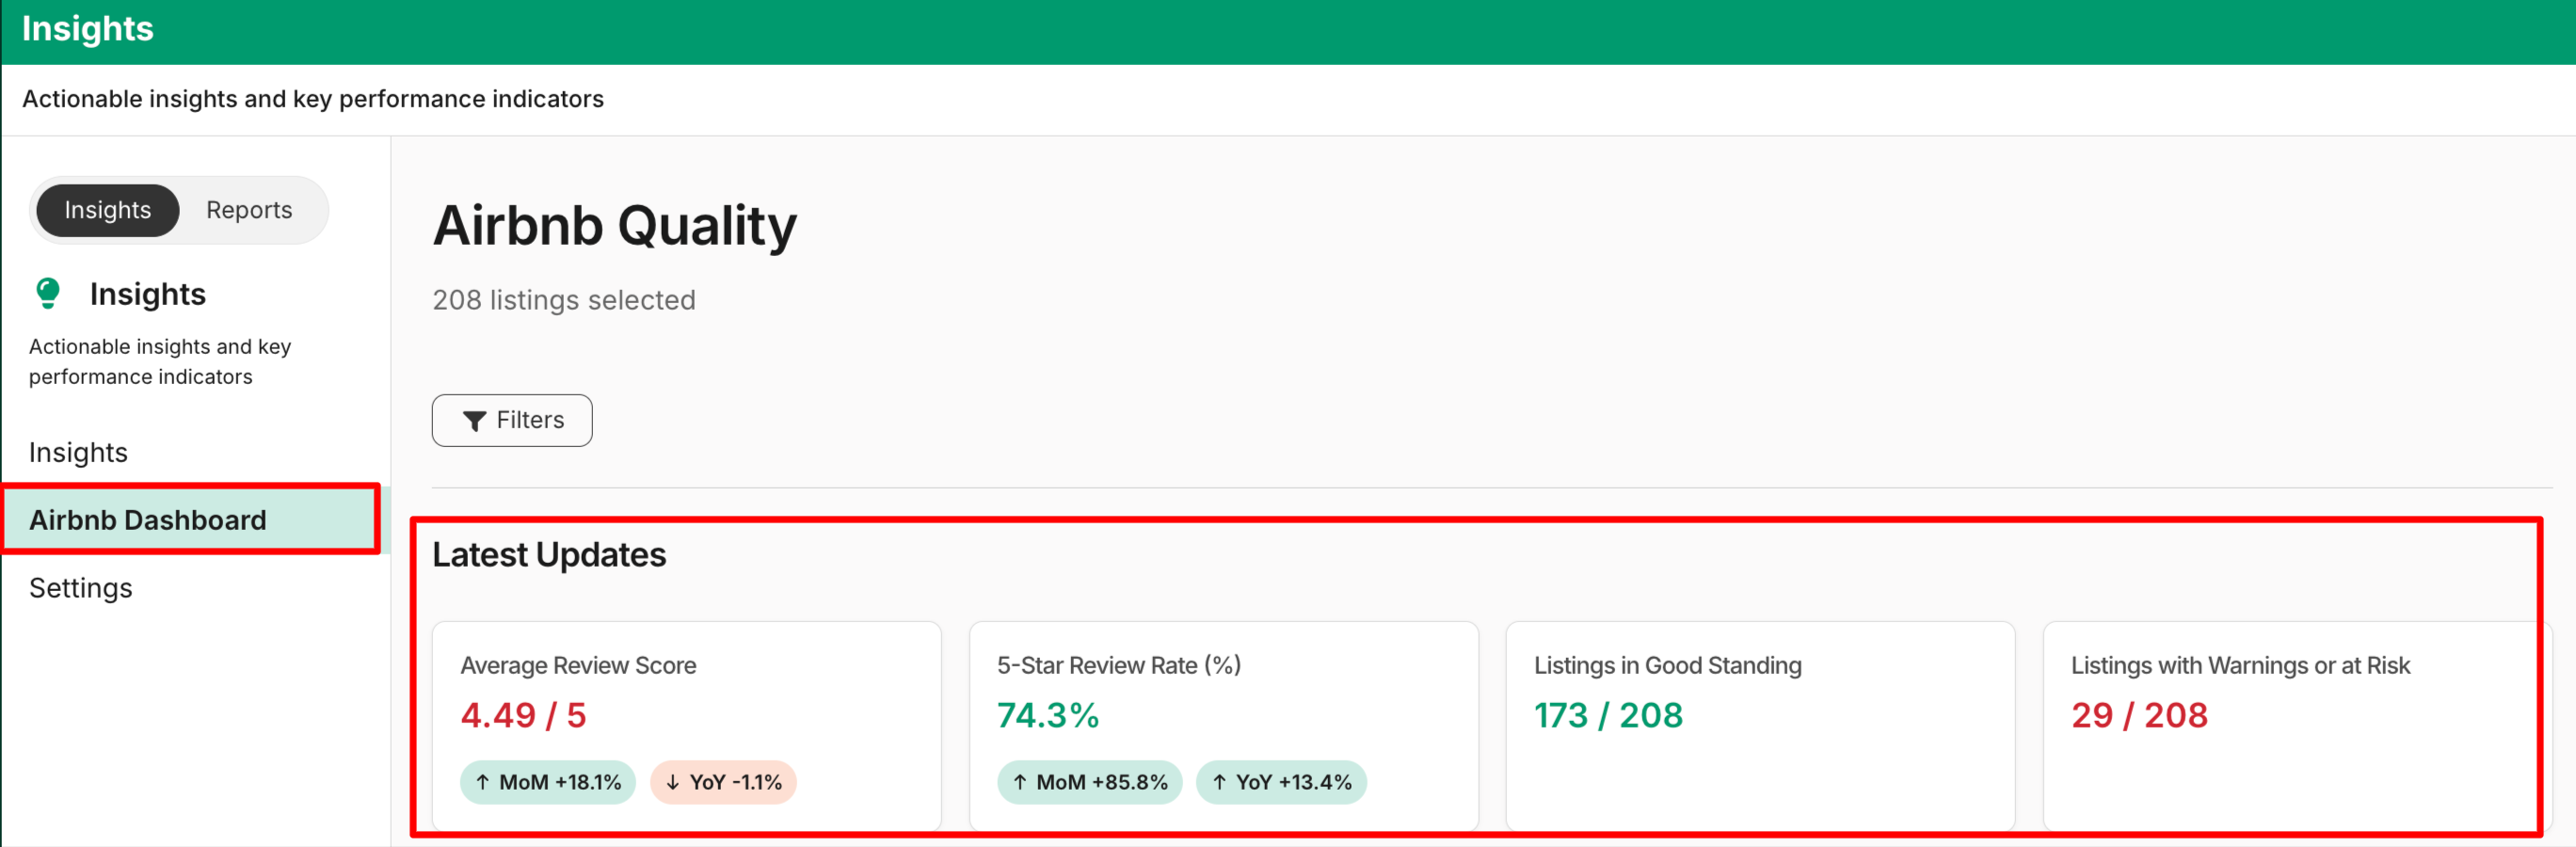
What metrics are included?
1. Average Review Score (0–5)
Displays your overall average guest rating and helps you track guest satisfaction to maintain Superhost-level standards.
The metrics include:
-
Current rating (e.g., 4.49 / 5)
-
Last month’s value
-
Month-over-Month (MoM) change
-
Year-over-Year (YoY) change
2. '5-Star' Review Rate (%)
Shows the percentage of total reviews that received 5 stars. This metric helps you understand how consistently you’re delivering exceptional guest experiences.
The metrics include:
- Current 5-star percentage
- Last month’s value
- Month-over-Month (MoM) change
- Year-over-Year (YoY) change
3. Listings in Good Standing
Shows the number of listings currently in Good or Educate status out of the total selected/filtered listings. Use this to ensure the majority of your listings are meeting Airbnb quality standards. The metric includes:
- Current count
4. Listings with Warnings or At Risk
Shows the number of listings with warnings or at risk out of the total selected/filtered listings. You can monitor this section closely to quickly address issues and prevent listing suspension or removal.
The metrics include listings currently in the following status:
- Warn
- Probation
- Additional Warn
- Pending Removal
- Displays:
- Current count
- Month-over-Month (MoM) change
- Year-over-Year (YoY) change
Updated 2 months ago